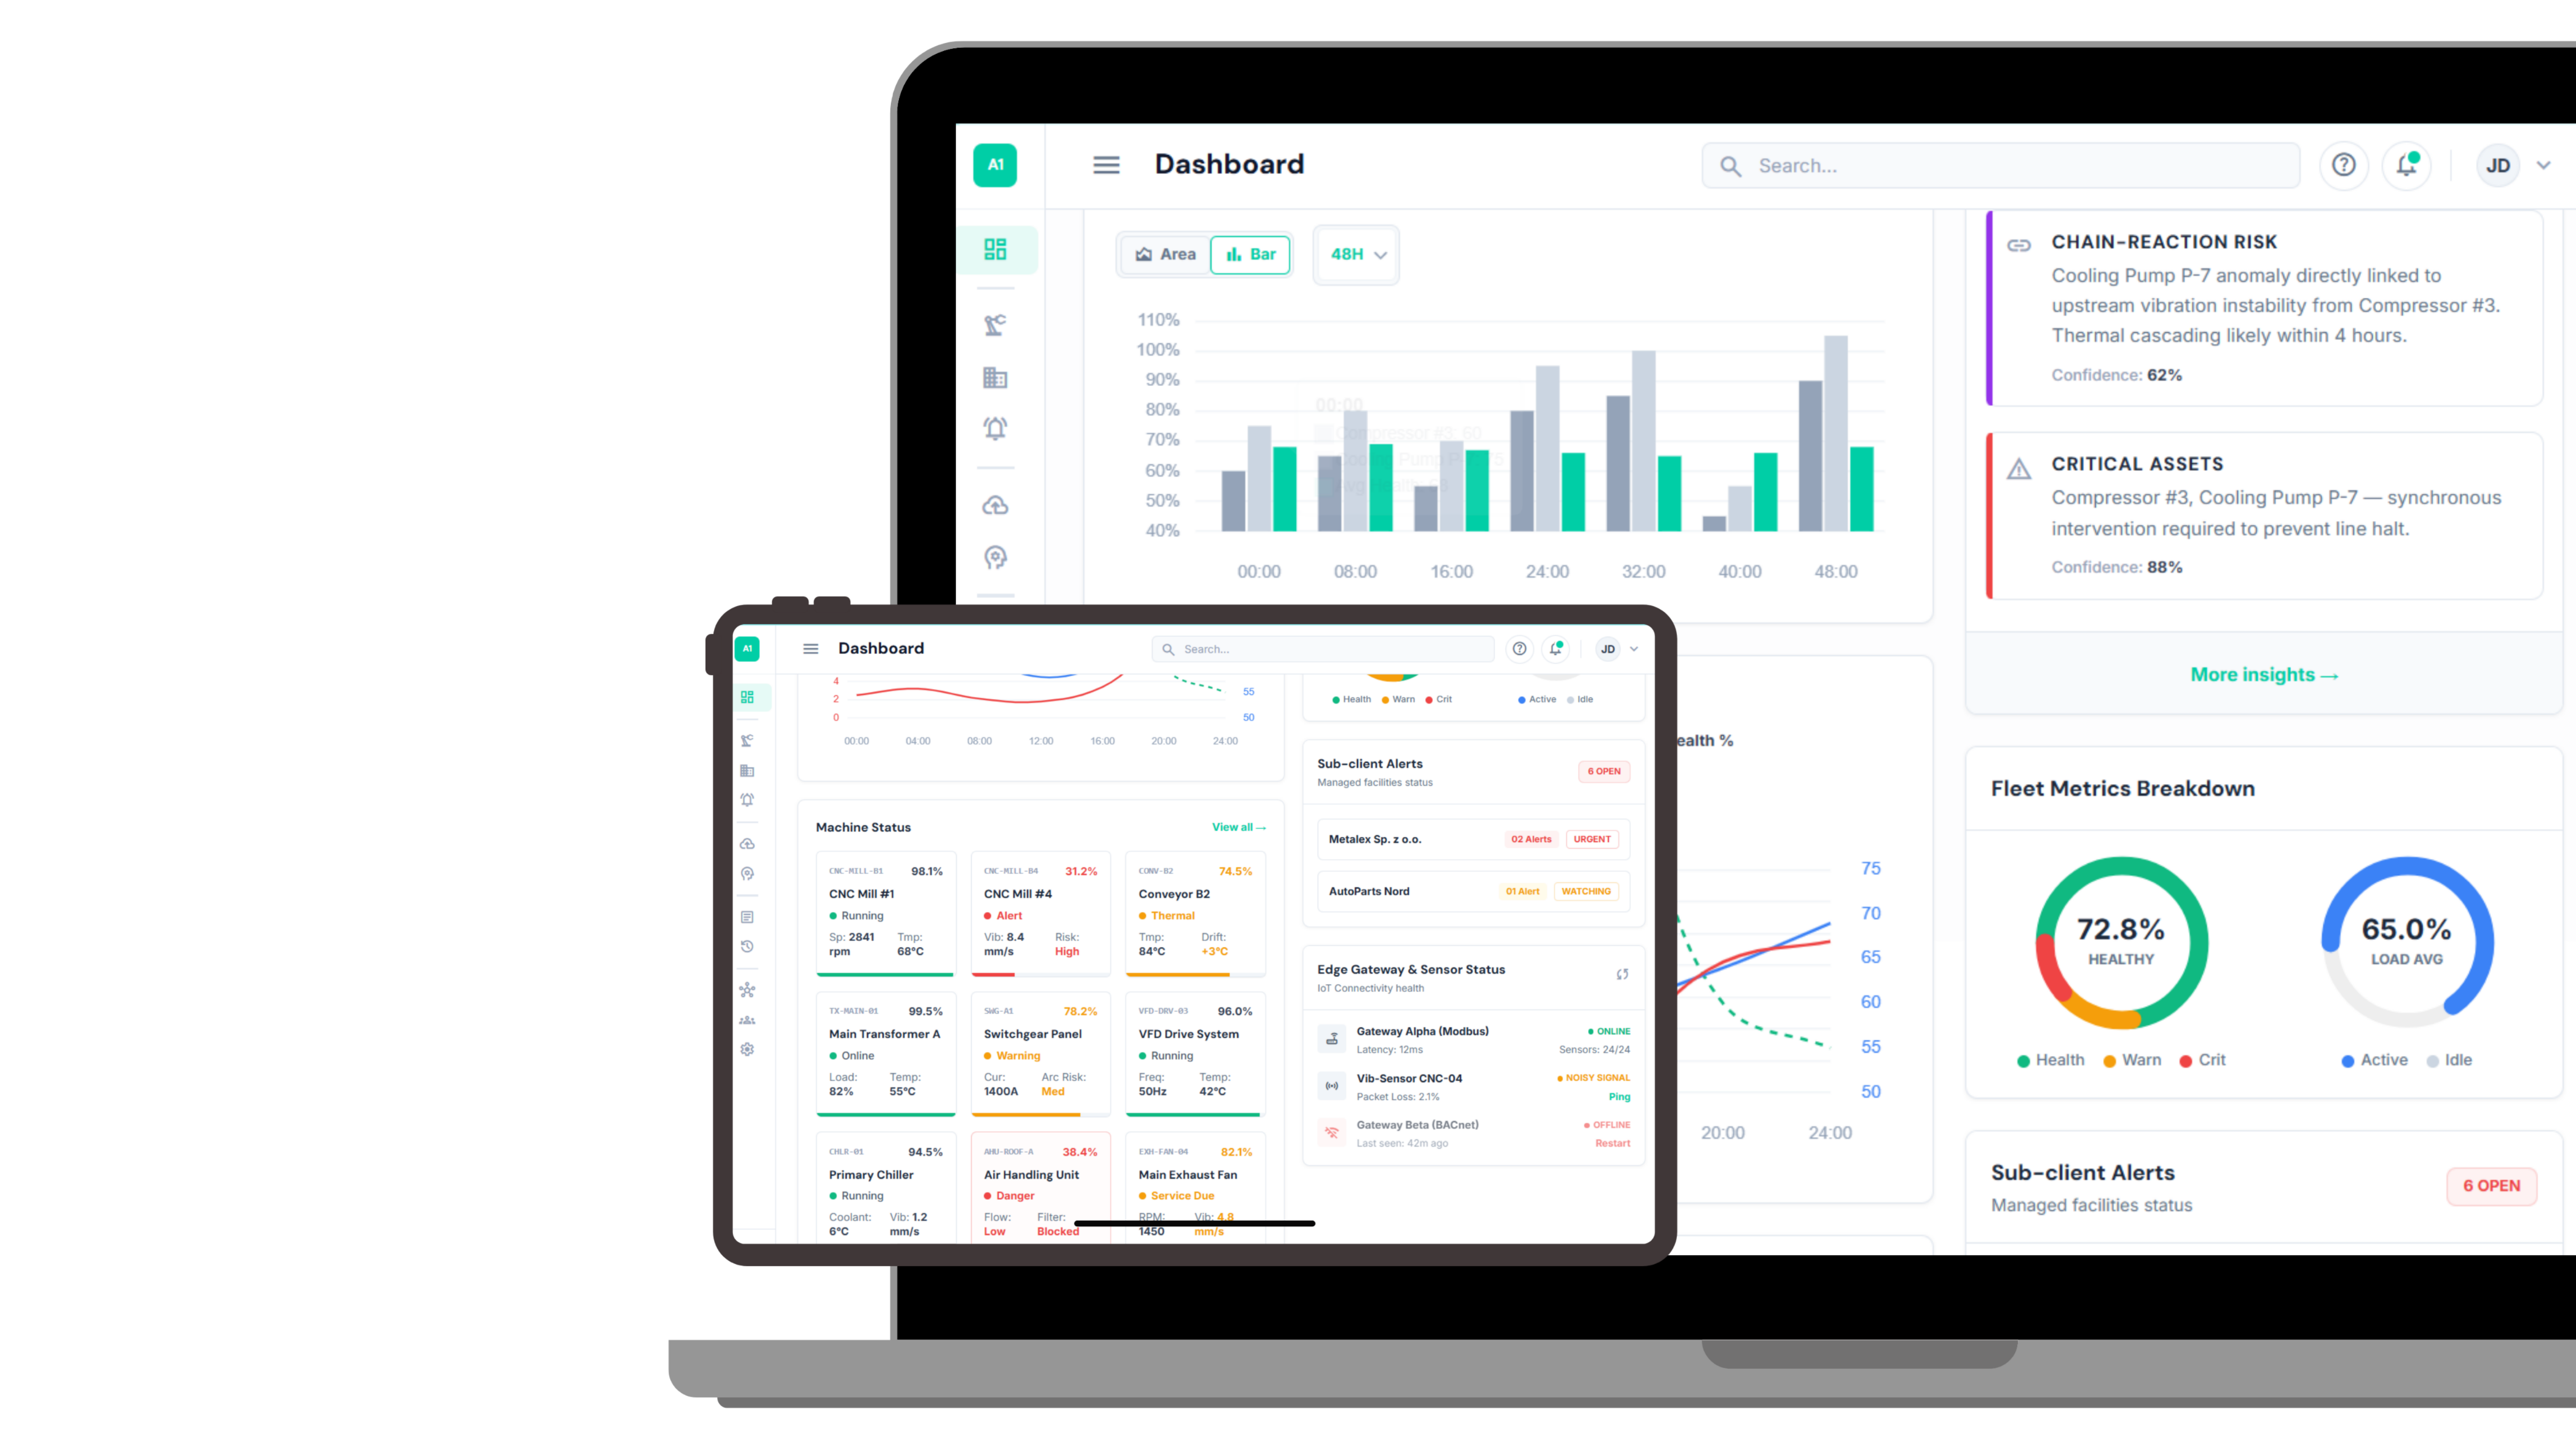
Solutions How It Works Pricing Industrial Services Contact

From raw sensor data to engineering intelligence - in 20 minutes.

SKOLDERN connects machine signals, operating context, and AI decision logic into one continuous operating cycle. The result is not another dashboard. It is a maintenance workflow that tells your team what matters, what it may cost, and what to do next.

SKOLDERN process dashboard
Operational flow One inspection chain from raw telemetry to engineering action.
Every second Data can be ingested continuously from live assets and site systems.
Every 20 minutes The AI cycle refreshes risk signals, health trends, and failure patterns.
Every hour Engineering-ready evidence can be turned into structured reports and review outputs.
Before failure Teams receive time to prioritize, prepare, and protect production instead of reacting late.
01

Continuous Collection

Sensor readings captured every second via OPC-UA, Modbus, BACnet, MQTT, and direct PLC connections. No factory modifications required.

  • Reads live data from existing plant infrastructure without interrupting operations.
  • Accepts both machine-level signals and site-level context such as load, shift condition, and environment.
  • Creates a stable machine baseline before the system begins escalating anomalies.
OPC-UA Modbus BACnet MQTT PLC sync
Sensor data collection
Input layer Plant data enters one structured stream instead of scattered manual checks.
02
AI analysis network
Decision engine Noise is filtered out so teams see patterns worth acting on.

AI Analysis

Multi-stage AI pipeline processes data every 20 minutes. Detects invisible fault signatures that human inspectors miss entirely.

  • Compares vibration, temperature, electrical behavior, and operating drift in one model cycle.
  • Separates process noise from real degradation signals, reducing false positives and alarm fatigue.
  • Ranks risk by technical severity and likely economic exposure, not by raw threshold breach alone.
20-minute cycle Multi-stage AI Pattern recognition Risk scoring
03

Engineering Report

Professional 12-section report generated every hour with ISO-standard analysis. Fully automated without any human input.

  • Turns AI findings into language maintenance teams, contractors, and decision-makers can review quickly.
  • Combines fault evidence, trend interpretation, and action framing in one report cycle.
  • Creates a traceable record for review, budgeting, escalation, and future audits.
12 sections ISO-ready Hourly output Review evidence
Dashboard and reports
Evidence layer Reports explain what changed, why it matters, and what teams should prioritize next.
04
Factory protection
Action layer Interventions are planned earlier, with clearer priorities and lower disruption.

48h Failure Alert

Immediate alert via email and WhatsApp before any performance drop is visible. Predict the exact downtime window to save time and money.

  • Pushes urgent cases into the team workflow before production loss becomes obvious on the line.
  • Gives planners time to align maintenance windows, parts, contractors, and site access.
  • Supports faster decisions across factories, utilities, and service-led industrial contracts.
Email WhatsApp Engineering queue Planned intervention

The process is built to shorten search time, improve confidence, and move teams from raw alarms to financially smarter action.

Less hunting

Engineers spend less time searching for the likely fault zone because telemetry, context, and evidence are already connected.

Better timing

Maintenance windows are driven by predicted risk and asset importance, not guesswork or rigid calendar routines.

Clearer reporting

Leadership, maintenance, and service teams can review one common narrative instead of disconnected observations.

Stronger economics

Production exposure, maintenance cost, and intervention priority become visible early enough to change outcomes.

Ready to give your factory a nervous system?

Join the manufacturers who never lose a production day to surprise failures.