Site ranking
Compare health across several facilities at once.
SKOLDERN helps organizations move beyond isolated plant dashboards. Compare sites, rank health, see alert pressure, and direct engineering attention where downtime, service cost, or missed availability matters most.
Multi-site operations is about control. Reliability leaders, utilities, and service providers need to know which plant is healthiest, where alert pressure is building, and which location carries the largest economic exposure if intervention is delayed.
Compare health across several facilities at once.
Spot which locations need intervention before local teams escalate.
Direct field resources where the business case is strongest.
Manage several customers, regions, or site types inside one logic.
The more locations you run, the more important ranking, comparison, and remote triage become.
Designed for organizations that cannot rely on one plant at a time and need a bigger operational picture.
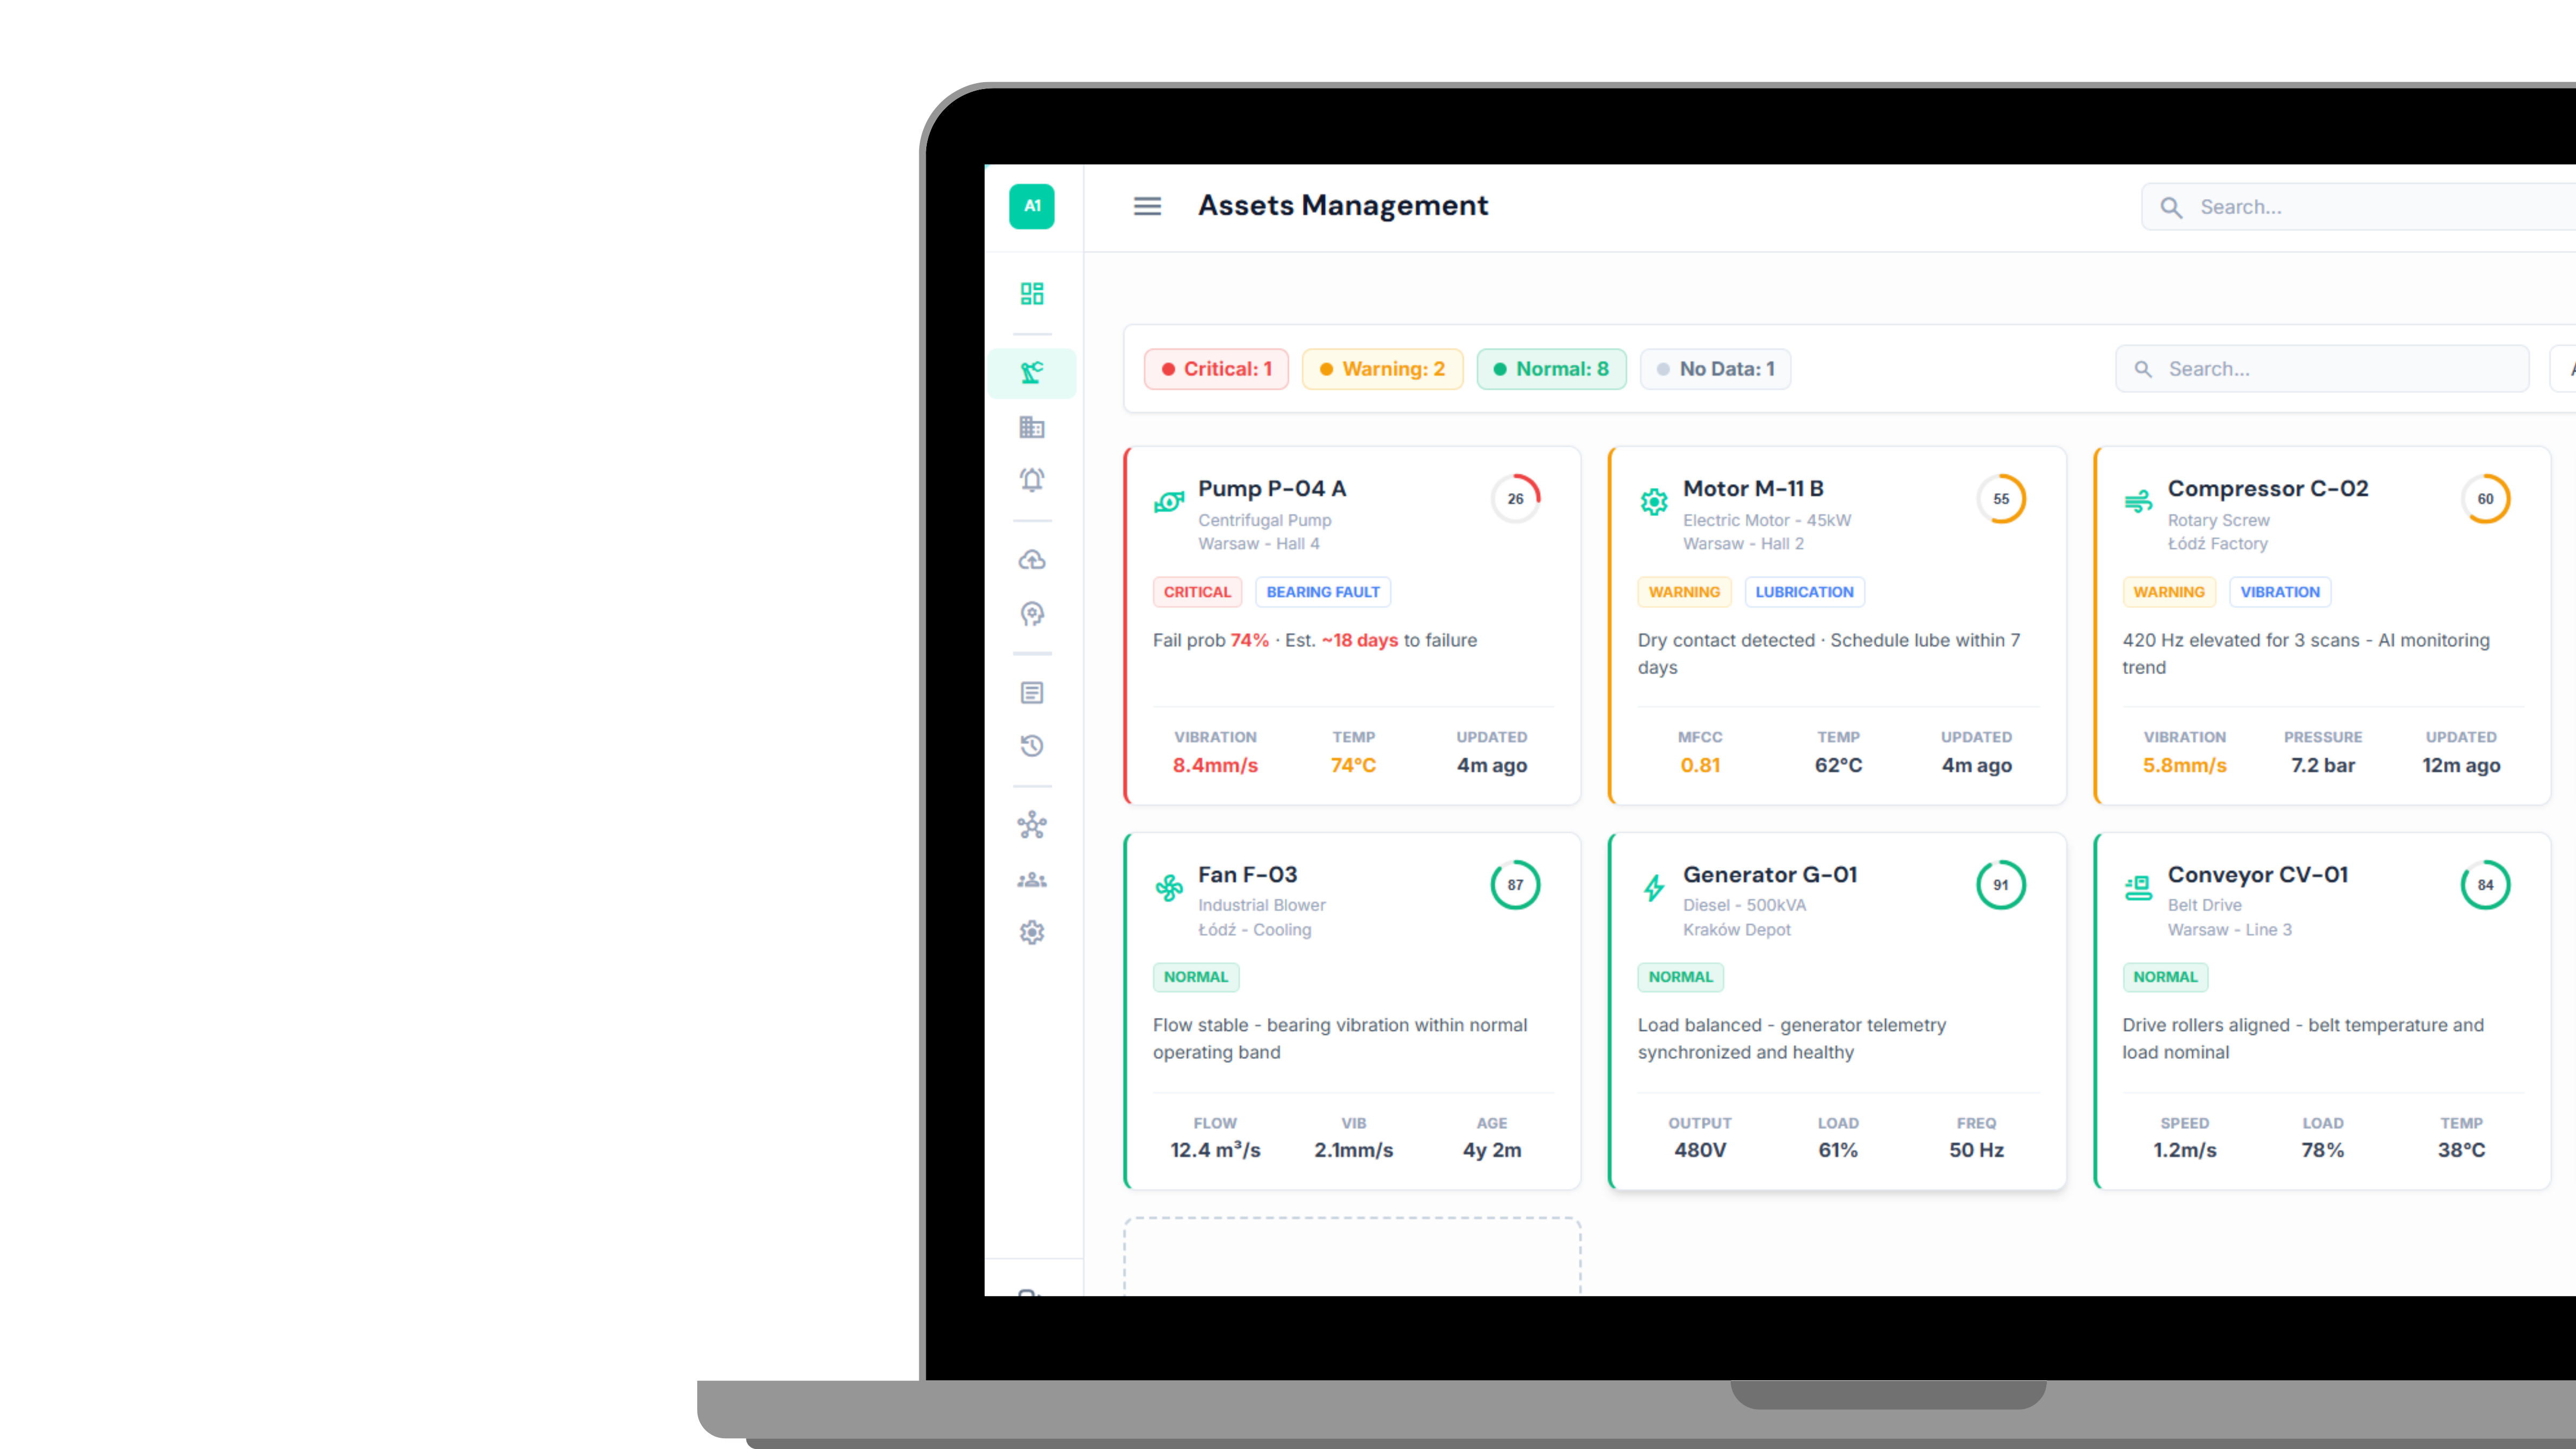
Rank factories, energy sites, depots, or client portfolios by current health and intervention urgency.
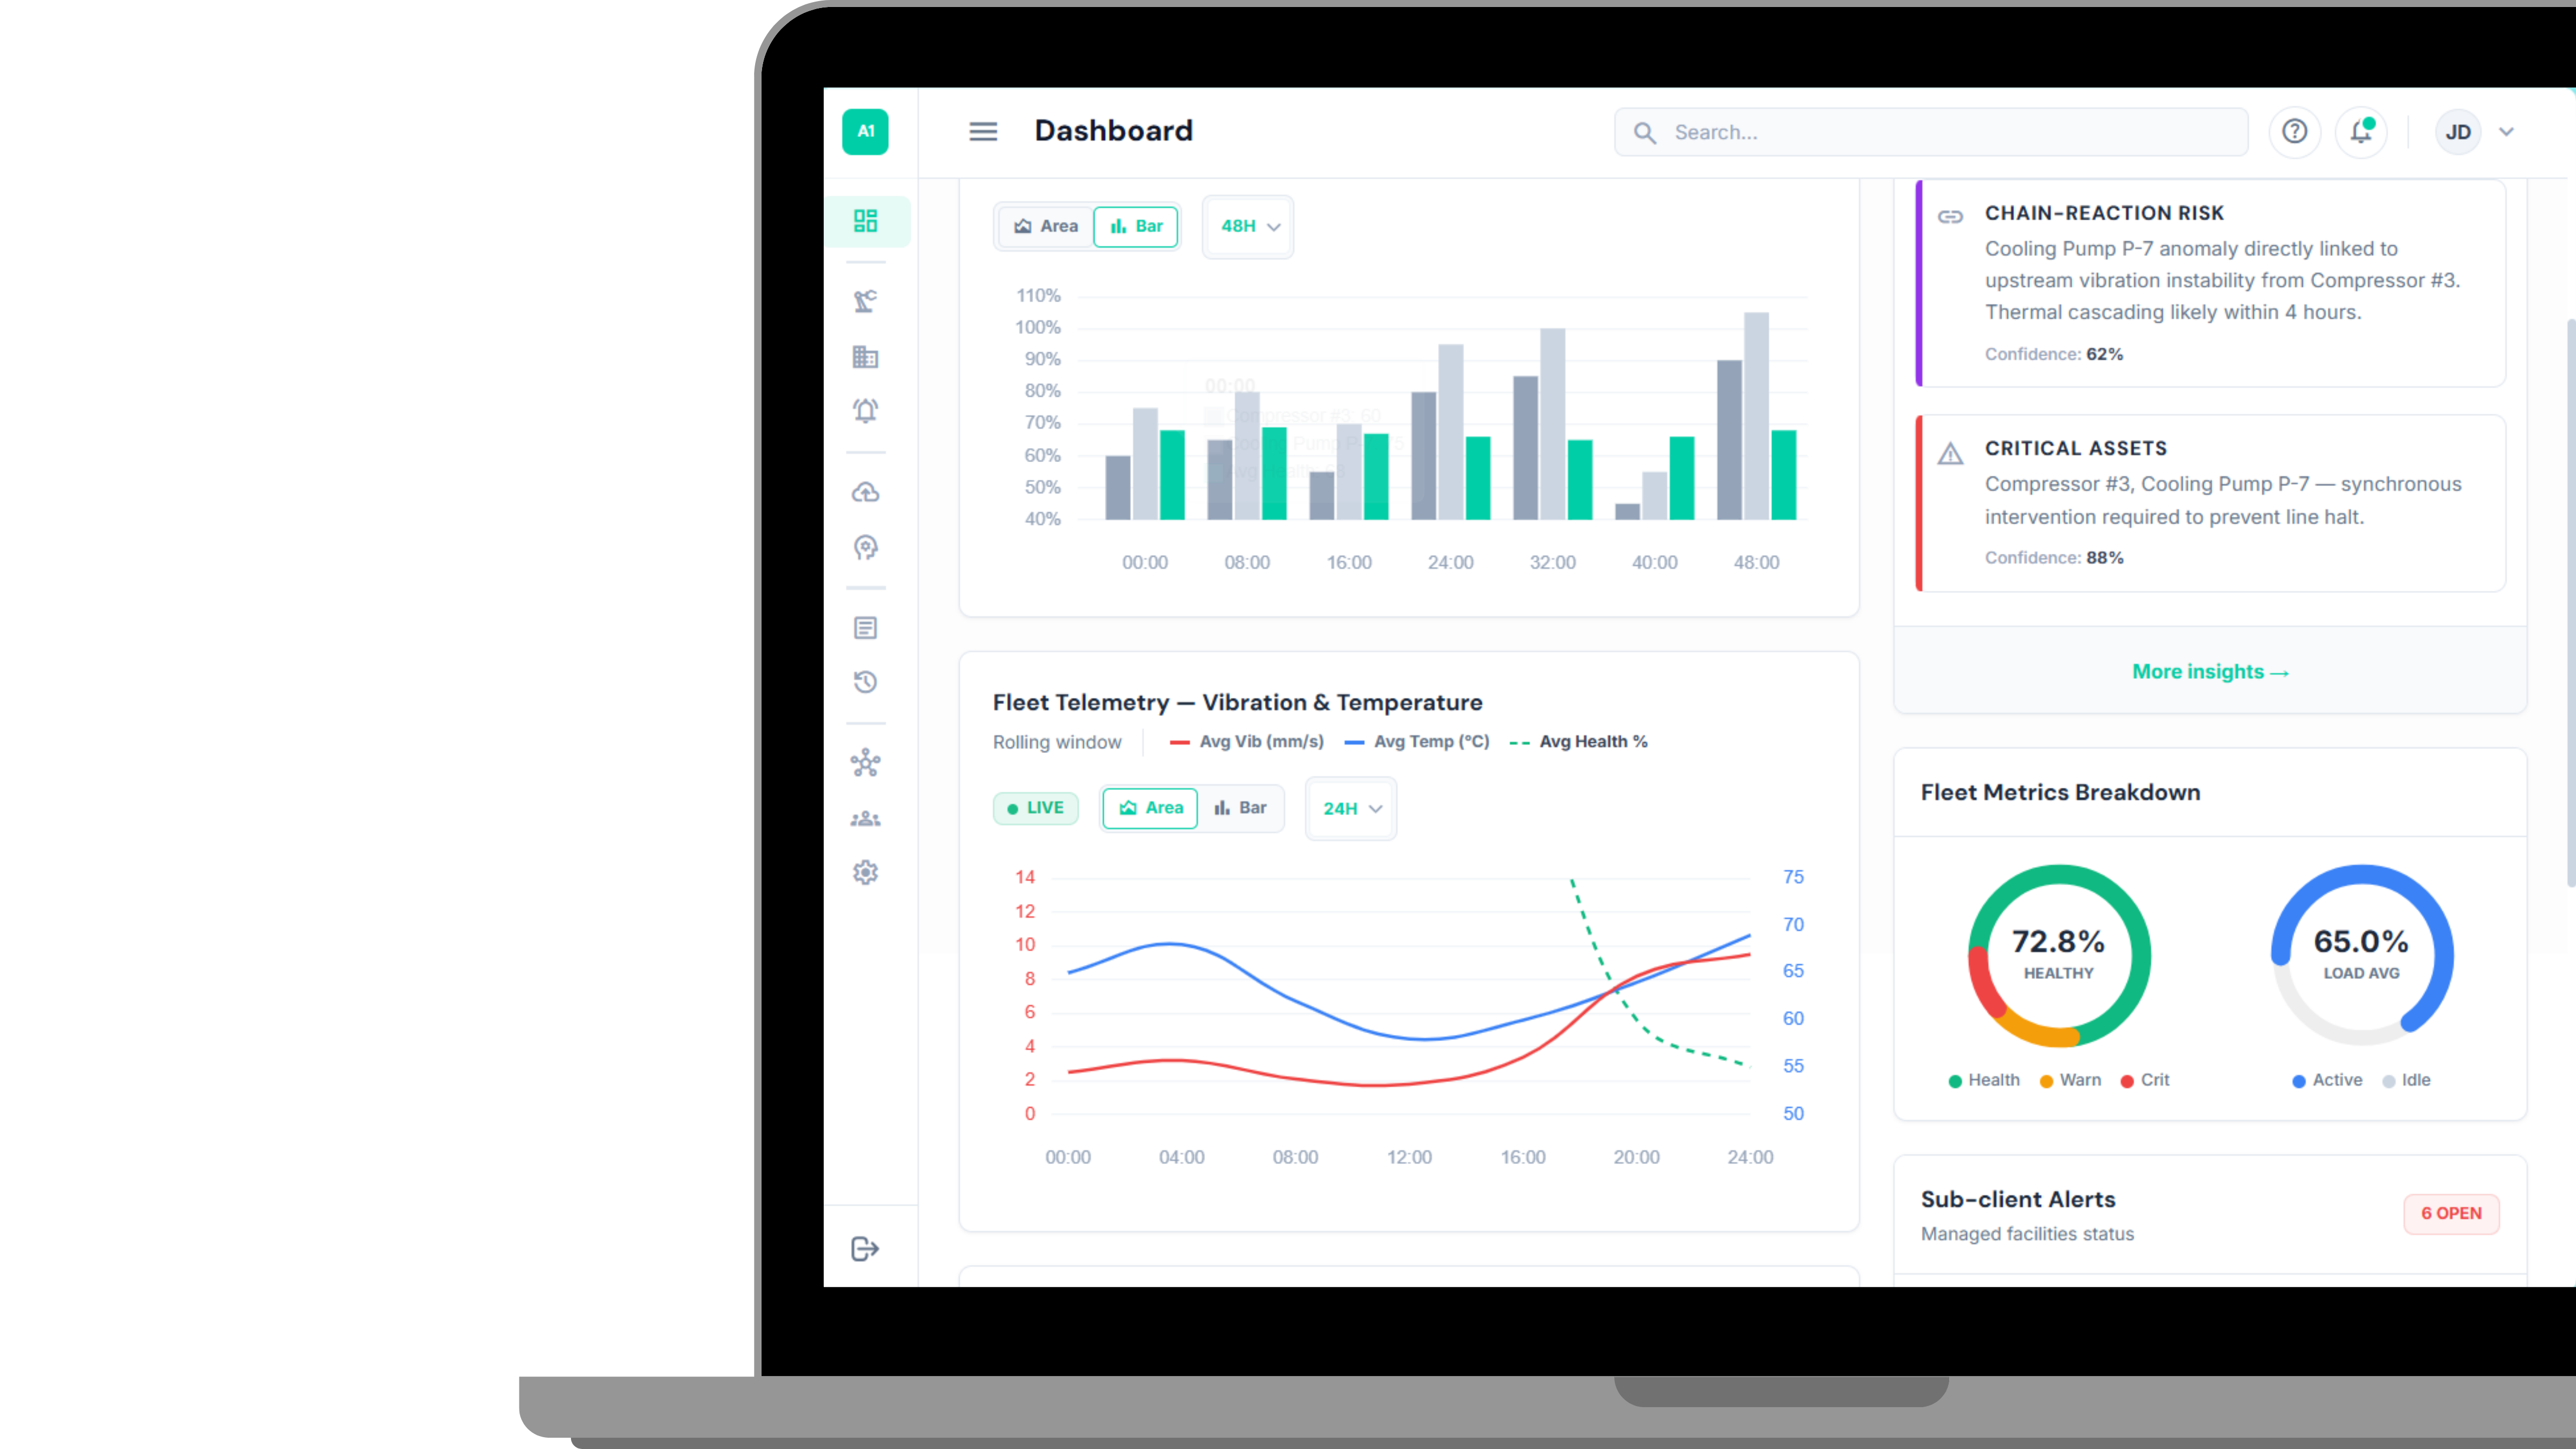
See where warnings and critical states are clustering so oversight teams can focus immediately.
Track active assets, monitored assets, and operational coverage per location.
Send engineers, contractors, or remote reviews where they protect the most value first.
Leadership and reliability teams do not have to wait for every site to explain its own status manually.
Use a consistent site review model for different plants, customers, or utility regions.
Field teams can be directed to the sites with the largest risk concentration instead of spreading effort evenly.
Leadership can see which locations justify deeper rollout, sensor expansion, or maintenance spend first.
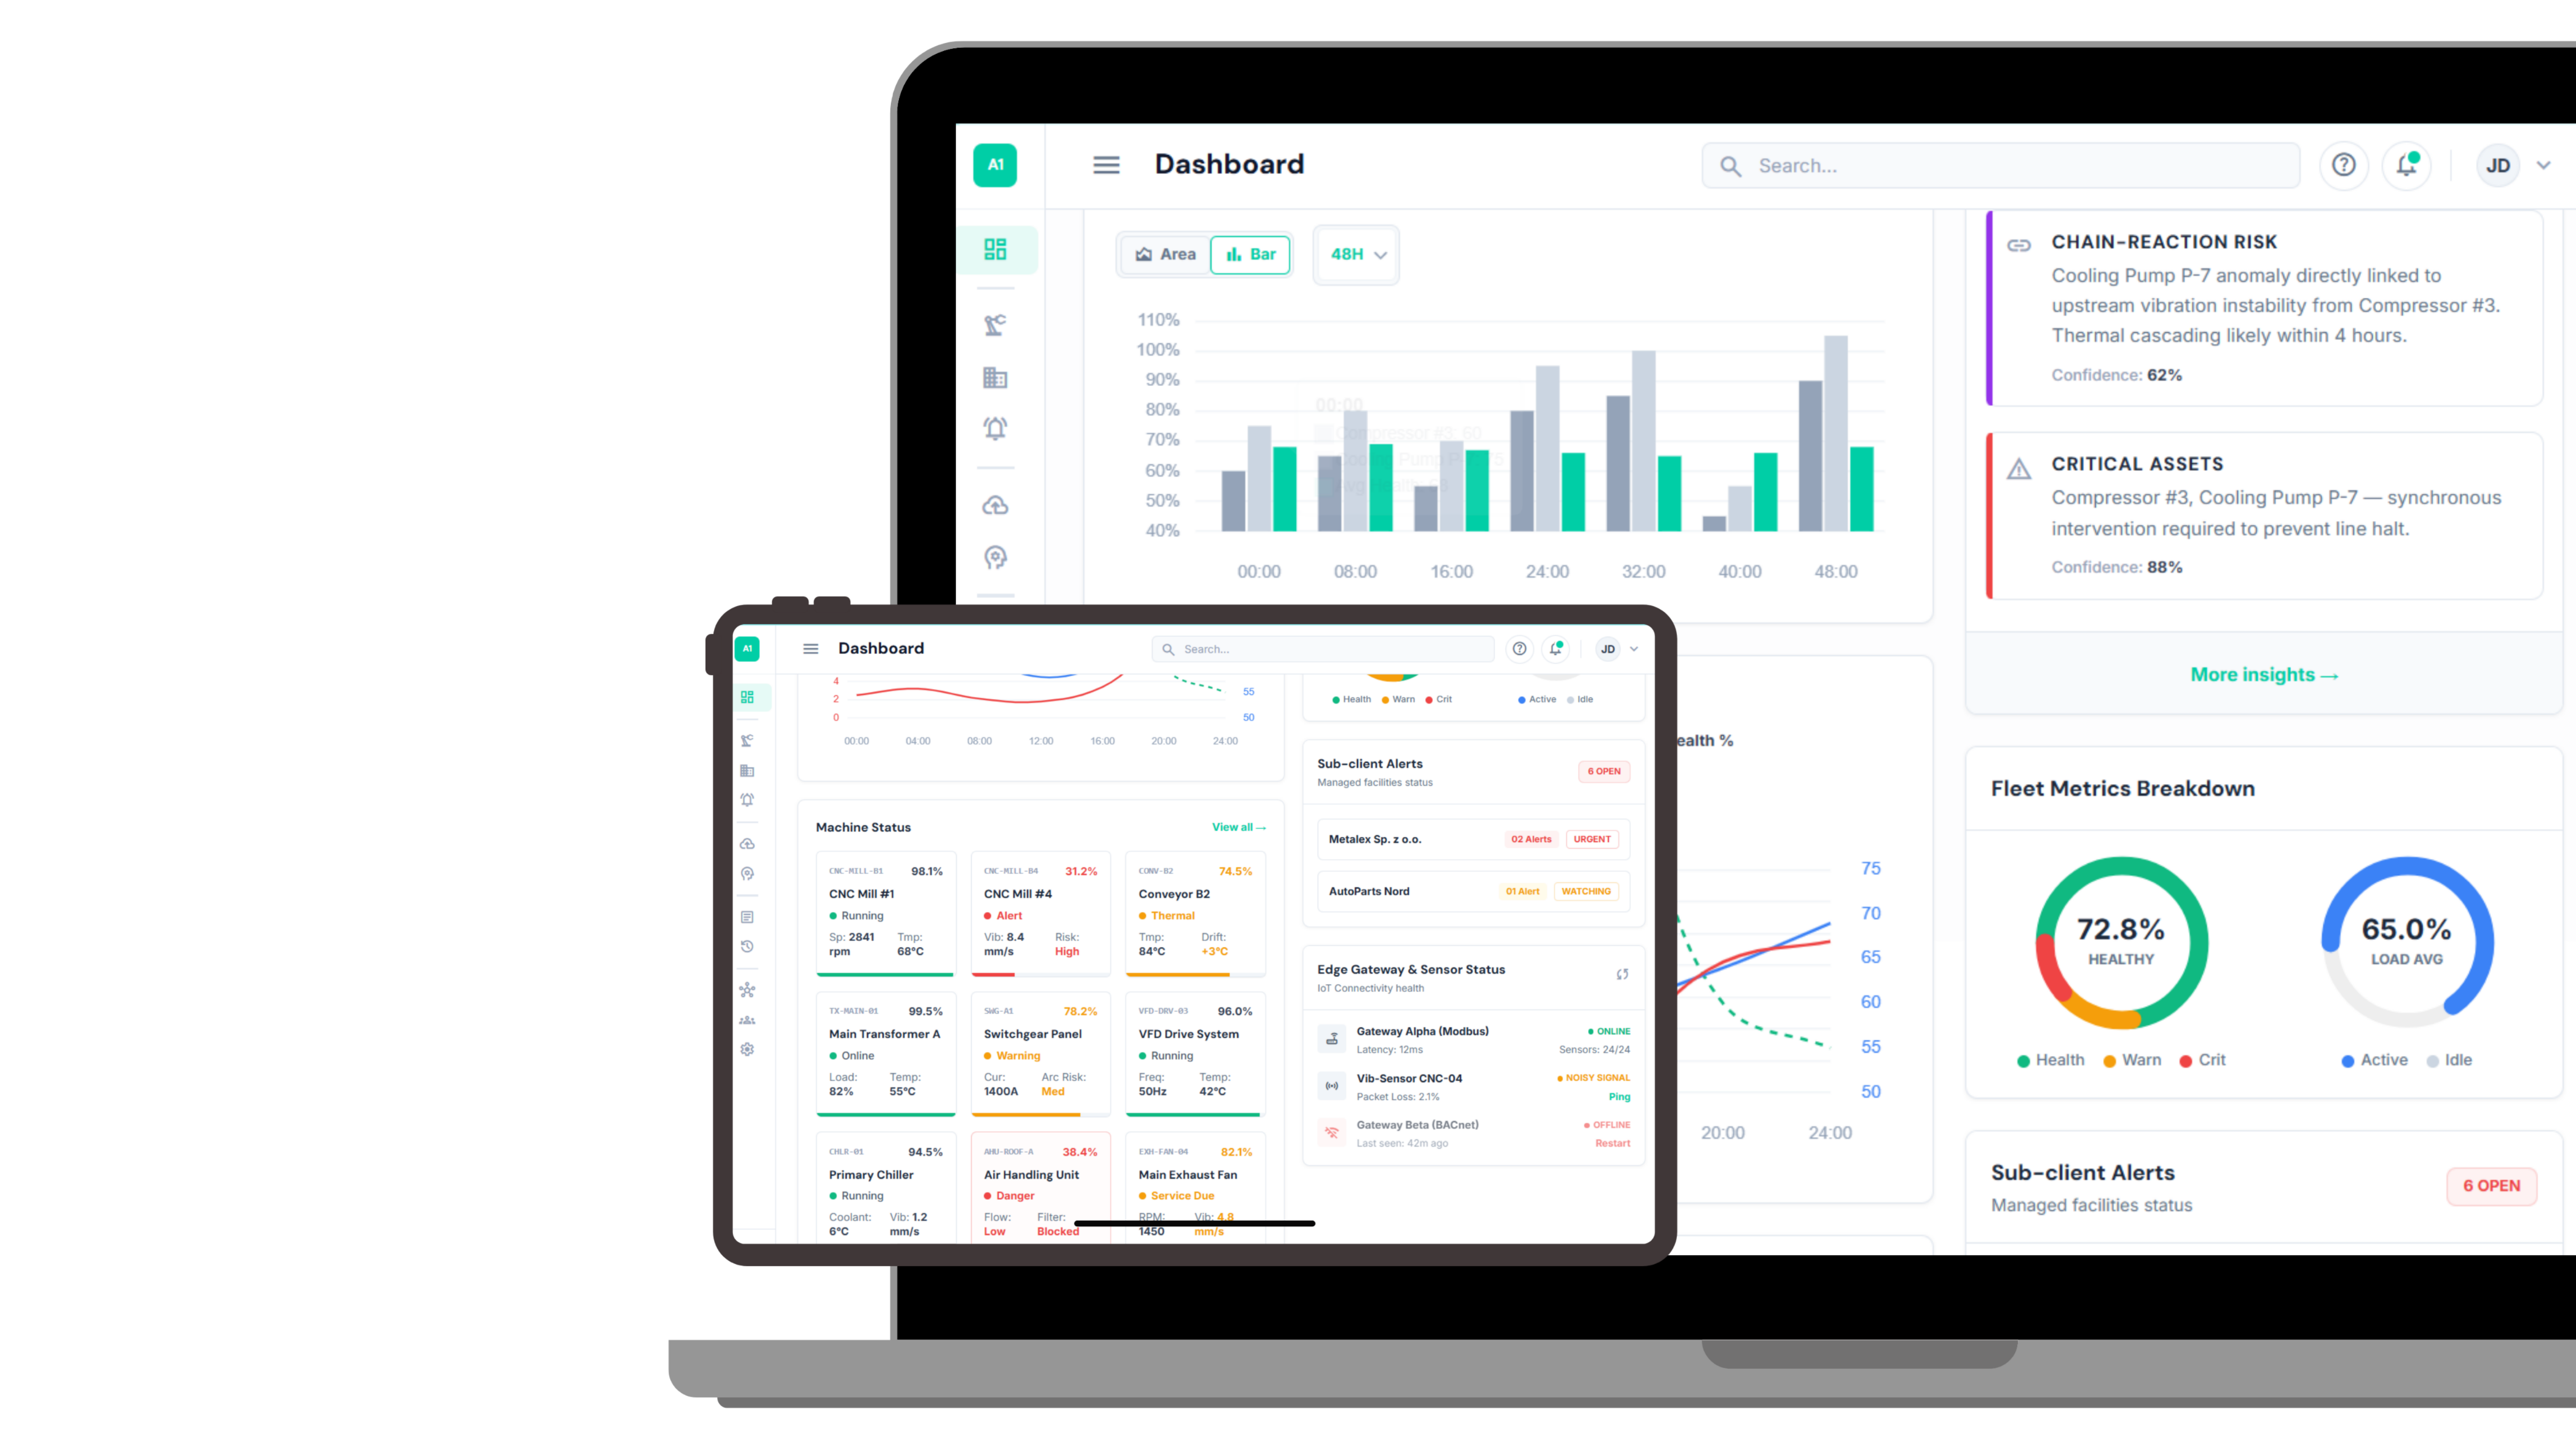
Managed-service teams can monitor several customer sites without losing sight of asset importance and site health.
Move from isolated plant views to one site-by-site control layer.
Help leadership and engineering look at the same priorities.
Send the right people to the right site at the right time.
Expand where value is already proven and economically visible.
The same calculator becomes stronger at portfolio level, because downtime risk can be prioritized where it hurts most.
Each location contributes asset health, alert state, and supporting operational context into one shared layer.
SKOLDERN compares site health and intervention pressure so teams know what needs attention first.
Remote teams, plant teams, and service providers can decide whether the next step is review, visit, or maintenance escalation.
Management can track how decisions improved availability, reduced reactive pressure, and justified broader deployment.
Operations, reliability, field service, and management can all see site-level priorities without separate reporting chains.
Manufacturers with several plants, utilities with distributed assets, and service providers managing multiple customer sites.
No. It is valuable as soon as there is more than one site competing for the same engineering time and attention.
Because the feature helps avoid misallocated travel, slow escalations, and weak prioritization when risk is spread across different locations.
Yes. It helps service providers prove which customer site needs intervention, which increases the value of preventive service delivery.
A good starting point is the set of sites where one failure causes the most downtime cost, travel burden, or availability risk.
We can review your sites, customer locations, or utility assets and suggest the strongest rollout sequence.